TUTORIAL VIDEO
While we explain everything in great detail below, we do have a video tutorial as well for technical back-testing in Trade Machine Pro. Here is that video:Trade Machine™ Pro Technical back-testing
TECHNICAL INDICATOR: "TTM SQUEEZE"
Note: There are many ways to parameterize this technical indicator and we explicilty demonstrate our choices. While there are other ways, this is what we found to work.John Carter (@johnfcarter on Twitter), one of the great traders of our time, many years ago, discovered that a combination of three technical indicators revealed a powerful signal.
Below, we try to capture the highlights behind the indicator, but we do highly recommend the full-blown video that Mr. Carter posted to YouTube back in 2014:
How to Use it in Trade Machine™ Pro
Using the indicator will be as easy as everything else in Trade Machine. Click a button.
The Idea -- Broadly
The idea behind all of this is rather shrewd. Mr. Carter notes that stocks have patterns, and in this case the pattern, across all time frames, is that "stocks 'explode' for short periods of time - then they chop around for 80% of the time."
He goes on to say that, "during the 'chop phase,' there is a period of time when the market gears up to 'explode' for another short burst."
This quiet period is known as the squeeze, and it the period right after the squeeze we are trying to identify with the combination of three technical indicators.
A Quick Review
A Squeeze is the tlow volatility period when and one range technical indicator trades inside another. This was the pre-cursor for a potentially large move out of that tight range once the squeeze was broken.
When adding a momentum indicator, the signal could then be honed in to mark it as a potential bullish or bearish move that was about to come out of the squeeze.
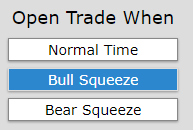
How It's used in Trade Machine™ Pro
For the back-tester, we look for a squeeze (the low volatility period) to start and apply these rules:
* The Squeeze (the period of low volatility) must last at least 6 trading days.
* Once that occurs, the stock is on alert, meaning when it breaks out of that squeeze, we use it as a trigger for the back-test indicator.
* Once the squeeze is broken (once the stock moves out of the tight range), we measure the one-day change.
* If the 1-day momentum (1-day change) is positive and also above 1%, it is triggered as a Bull Squeeze. If the positive move is less than 1%, then the trigger in Trade Machine is not turned on.
* If the 1-day momentum (1-day change) is negative by any amount, it is triggered as a Bear Squeeze.
* Close Rules:
-- BULL CLOSE
Any of three things will cause the bull signal to close a trade in a back-test:
(1) The stock is down by 2% or more for two consecutive days.
OR
(2) The options used in the back-test expire.
OR
(3) A stop or limit is hit.
Any of three things will cause the bull signal to close a trade in a back-test:
(1) The stock is down by 2% or more for two consecutive days.
OR
(2) The options used in the back-test expire.
OR
(3) A stop or limit is hit.
-- BEAR CLOSE
Any of three things will cause the bull signal to close a trade in a back-test:
(1) The stock is up any amount for two consecutive days.
OR
(2) The options used in the back-test expire.
OR
(3) A stop or limit is hit.
Any of three things will cause the bull signal to close a trade in a back-test:
(1) The stock is up any amount for two consecutive days.
OR
(2) The options used in the back-test expire.
OR
(3) A stop or limit is hit.
That's it. We simply look for prolonged periods (at least 6 trading days) of low volatility as measured explicitly by two technical indicators, and then fire off a signal once the low volatility breaks and the stock moves with either positive or negative momentum.
Empirical Results
We tested the and optimized the triggers for this technical signal. The results were robust.
With 99% statistical significance, the bull trigger outperformed the standard call spread strategy. With > 99.999% statistical significance, the bear trigger outperformed the standard put spread strategy.
In English, based on the data we have over the last five-years and several thousand trades using the 270 most liquid optionable stocks, there is a high probability that the 'squeeze then trigger' rules we have found are in fact superior to a standard call spread or bear spread strategy.
More Details
The two-range bound technical indicators he used are:
* Keltner Channels: These are volatility-based envelopes set above and below an exponential moving average. Keltner Channels are a trend following indicator used to identify reversals with channel breakouts and channel direction.
In the Trade Machine, we use the 20 day simple moving average (SMA) and 10 day SMA for the 'true range' (TR) create the Keltner Channels and use a 2 ATR range (2*ATR).
And
* Bollinger Bands: Bollinger Bands® are also volatility bands placed above and below a moving average. For signals, Bollinger Bands can be used to identify the strength of the trend.
In the Trade Machine, we use the 20 day simple moving average (SMA) to create the Bollinger Bands.
The Difference
Keltner Channels as an indicator are similar to Bollinger Bands, which use the standard deviation to set the bands. Instead of using the standard deviation, Keltner Channels use the Average True Range (ATR) to set channel distance.
Examples
To put some visuals behind these indicators, we start with a 5-year chart of Apple Inc and simply plot the stock price with Keltner Channels.
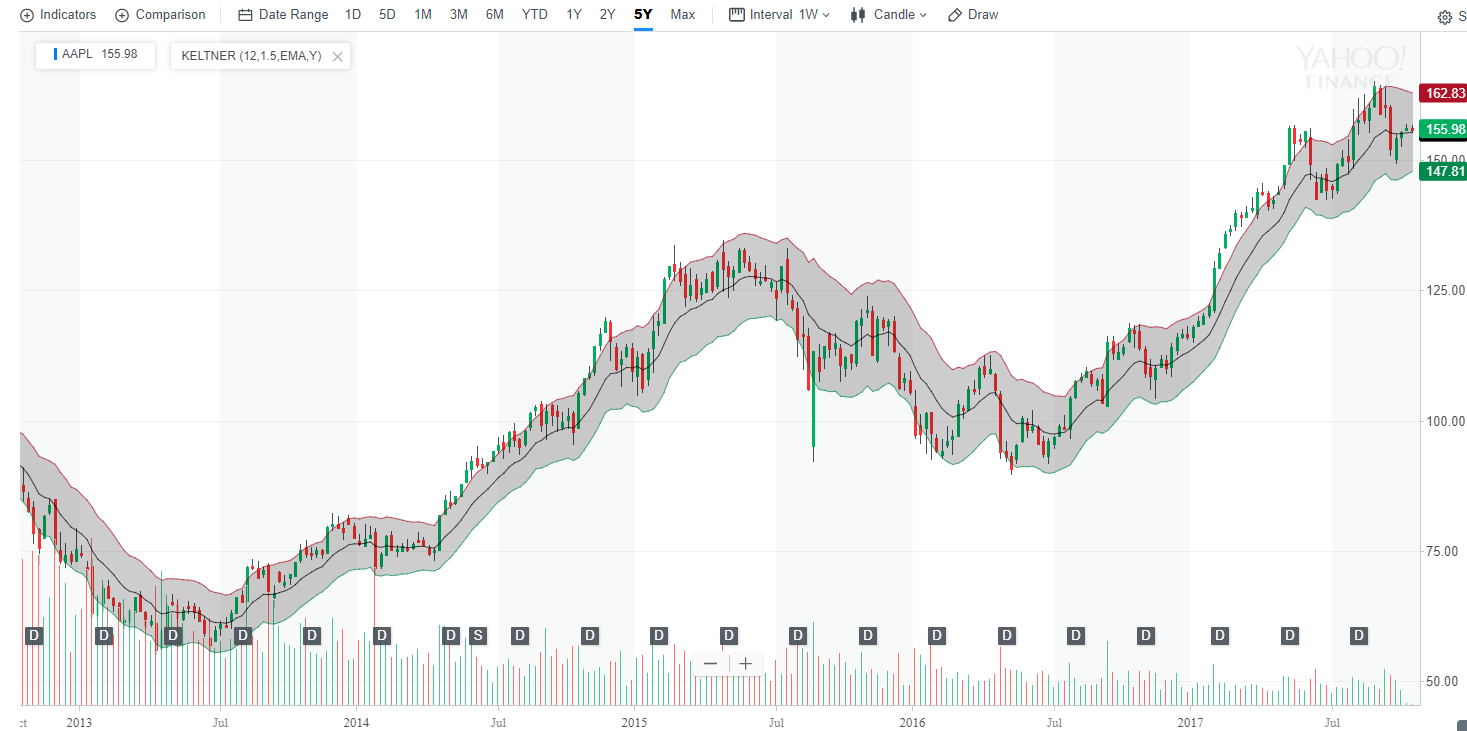
So, we can see that the indicator creates a band around the stock price -- meaning there is both an upper bound and a lower bound to this indicator.
A Bollinger Band looks similar. Here it is for Apple Inc (NASDAQ:AAPL) again, over five-years:
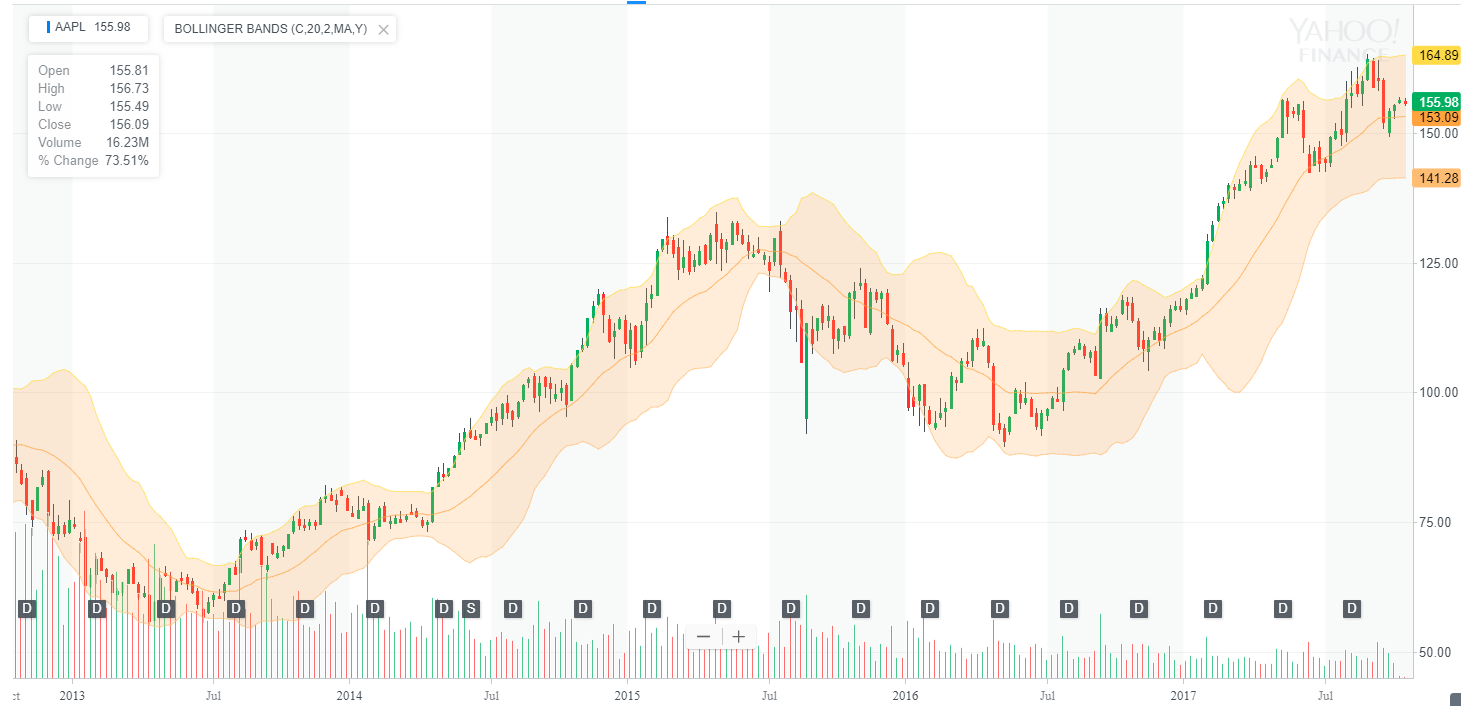
Again, we see an indicator which has bands -- so an upper and lower level.
When a Squeeze Happens
When the Bollinger Bands trade inside the Keltner Channels, called a "squeeze," stocks have a tendency to be ready for a large move (up or down).
In Practice
In practice this all combines into a simple rule:
Wait for the squeeze (Bollinger Bands trade inside the Keltner Channels) then look at the momentum to see whether this is a bullish or bearish potential breakout. Here is just a single example of this happening in the real world. We present this as a helpful visual aid that can tie all of this technical jargon together.
This example is taken from the YouTube video we posted above -- that is, it is from John Carter.
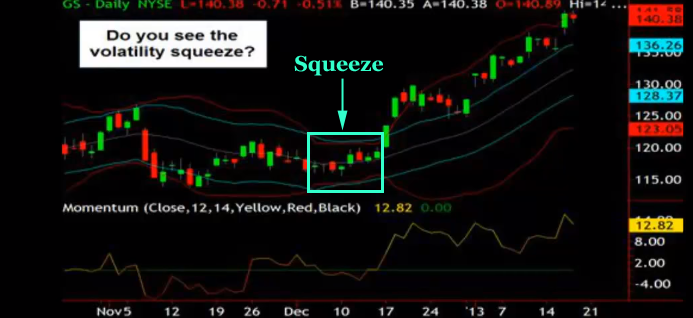
So, what we see is that the Bollinger Bands (the magenta lines) are inside of the Keltner Channels (the light blue lines). We have boxed it for convenience.
It's right after this "squeeze" that the stock could make its break out move, which in this case it did, to the upside.